
ConTech Funding Report: 2025
Where did ConTech investment flow in 2025?

Each week on Last Week in ConTech, we highlight the startups that are building solutions that impact the way in which the architecture, engineering and construction industry operates.
The goal of doing so is to increase the awareness of solutions with the hope that this increases adoption.
Due to this framing, our definition of what a ConTech startup is is quite broad and often we include construction adjacent startups which are building solutions for multiple industries but have construction listed as an industry served or their solution has the potential to solve an established pain point.
Based on this, we reviewed every startup featured in the newsletter throughout 2025 and aggregated the data to provide an overview of the state of ConTech funding.
Definition used for inclusion
A ConTech startup is any startup which is developing a technology which impacts the construction value chain. This could be from land development to design, engineering, planning and construction.
The definition also covers retrofitting, remodelling, infrastructure, asset management, logistics and installation.
The following categories were excluded from the analysis:
Building management systems / operations phase solutions (these weren’t included as it was considered ‘Proptech’)
Grid Tech startups
Charging infrastructure startups
Hyperscalers (companies that are building large scale data centers and offering computing and storage services)
Debt rounds were also excluded.
A note on methodology
One caveat to this year’s data vs the 2024 funding data we shared last year, is that this definition can be subjective. For example, in 2024 there were more ‘construction adjacent’ solutions included in the analysis. In 2025, informed by deeper industry conversations and feedback, we applied a stricter interpretation of what constitutes a ConTech startup.
To account for this bias, we have included a link to the raw 2025 dataset so readers can run their own analysis and form independent views.
Let’s dive in to the data.
Contents:
ConTech Investment in 2025
Investment by Region
Investment by Country
Investment by Category
Number of Deals
Amount of Funding
Top Category by Region
Investment by Bracket (stage)
Predictions for 2026 (sending in 2 weeks!!)
The material presented on Last Week in ConTech’s website are opinions only and are provided for informational purposes and should not be construed as investment advice. It is not a recommendation of, or an offer to sell or solicitation of an offer to buy, any particular security, strategy, or investment product. Any analysis or discussion of investments, sectors or the market generally are based on current information, including from public sources, that I consider reliable, but I do not represent that any research or the information provided is accurate or complete, and it should not be relied on as such. My views and opinions expressed in any website content are current at the time of publication and are subject to change. Past performance is not indicative of future results. Please consult an investment specialist before investing.
ConTech Investment in 2025
In 2025 there was $6.1b in funding for construction tech startups with 410 announced funding rounds. 44 of these startups did not disclose the amount raised.
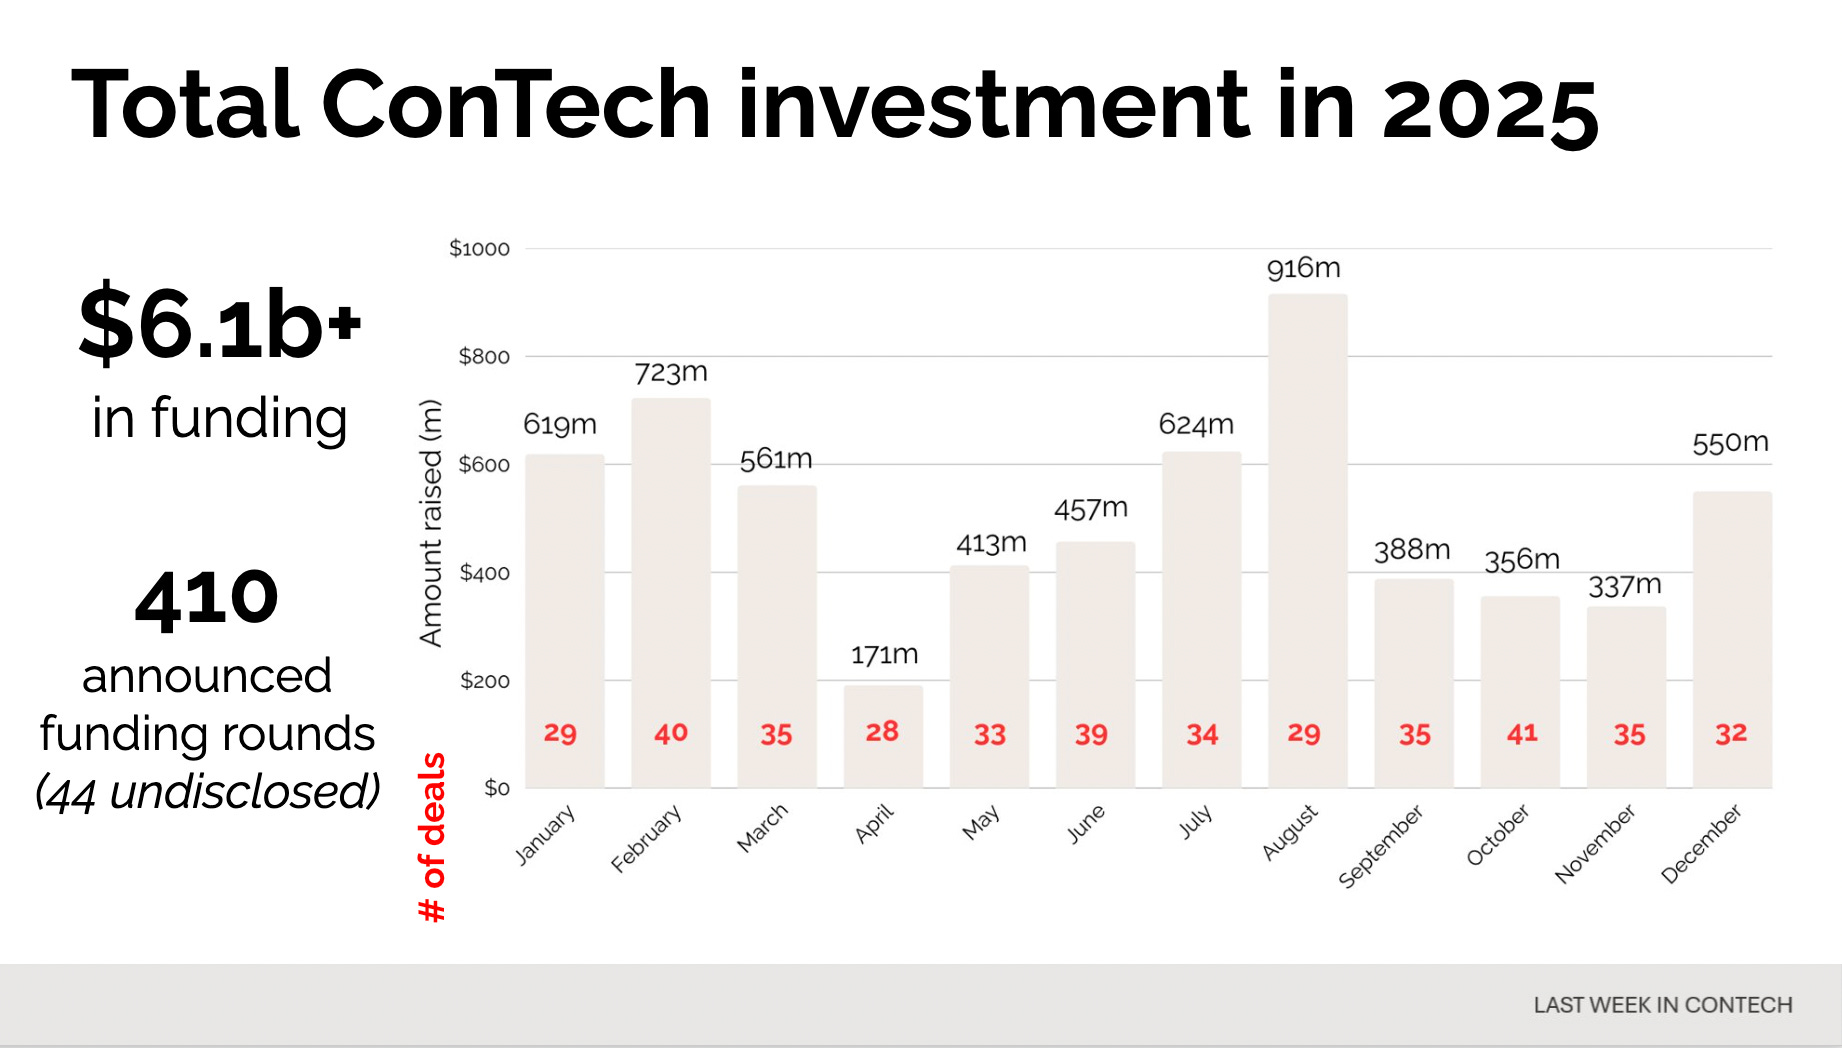
This contrasts with 2024 where also $6.1b was raised by 320 startups (38 undisclosed). As mentioned earlier, there were more ‘construction adjacent’ startups included in the previous year’s analysis (view 2024 raw data here).
One caveat I’d like to highlight is the discrepancy in startup reporting methods between publications due to definition. For example the 2024 funding numbers were reported by different publications as follows:
$6.1b - Last Week in ConTech
$3.1b - CEMEX
While activity (number of startup funding rounds) has increased, it is important to note that total venture funding rose in 2025 with crunchbase reporting $469b of investment in 2025, up 49% YoY ($314b in 2024). Construction Tech funding there made up 1.3% of total venture funding and with the construction industry accounting for ~13% of global GDP there is still opportunity to grow.
Investment by Region
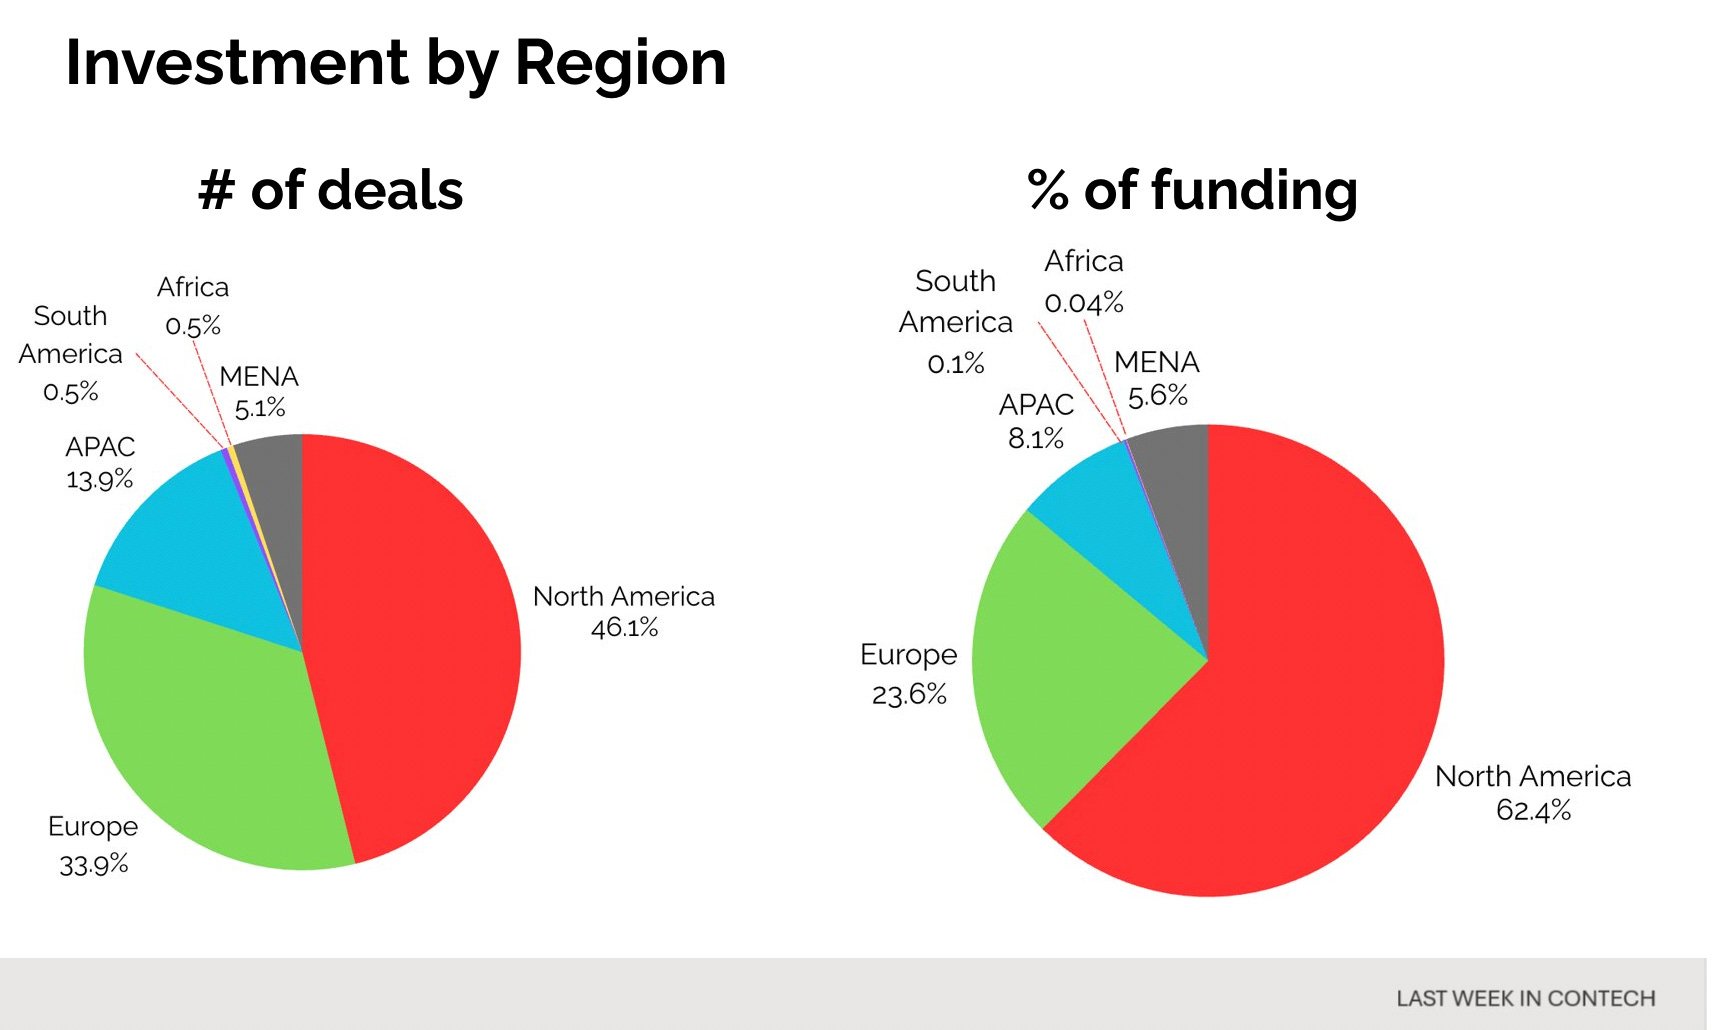
North America had the most amount of ConTech investment at $3.81b, accounting for 62.4% of the global total. This was followed by Europe at $1.45b (23.6%).
In terms of number of funding rounds, North America is still the primary market, however the difference between regions is less stark. There were 189 funding rounds while in Europe there were 139 being 46.1% of the total number of funding rounds and 33.9% respectively. The smaller discrepancy between the regions here is a reflection of the maturity of the European market, indicating that deals are primarily at an earlier stage. This gap in funding is expected to reduce over time as early stage companies mature and raise larger rounds.
A similar difference was noted in the APAC region where the amount of funding was 8.1% of the global total while the number of deals was 13.9%.
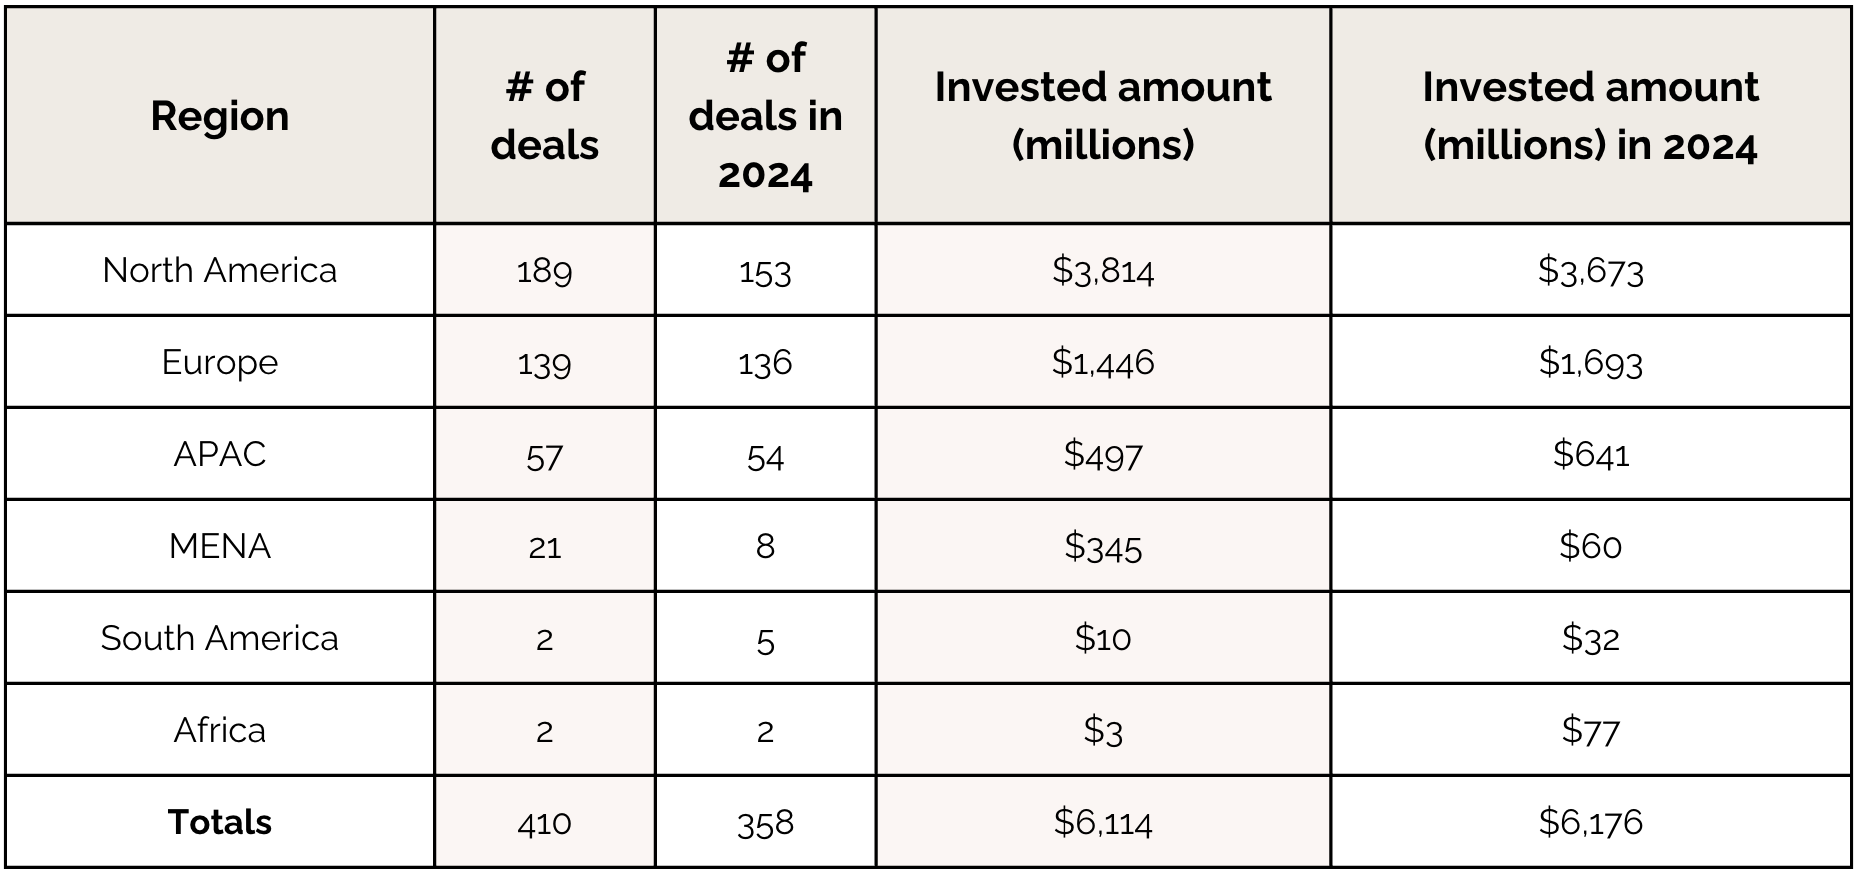
Comparing the 2025 data to 2024, the number of rounds in each region has grown with MENA having the largest change.
Investment amount continued to grow in North America while it fell in Europe and APAC despite an increase in the number of rounds. It is important to note 12 startups in Europe and 9 in APAC did not disclose the amount raised.
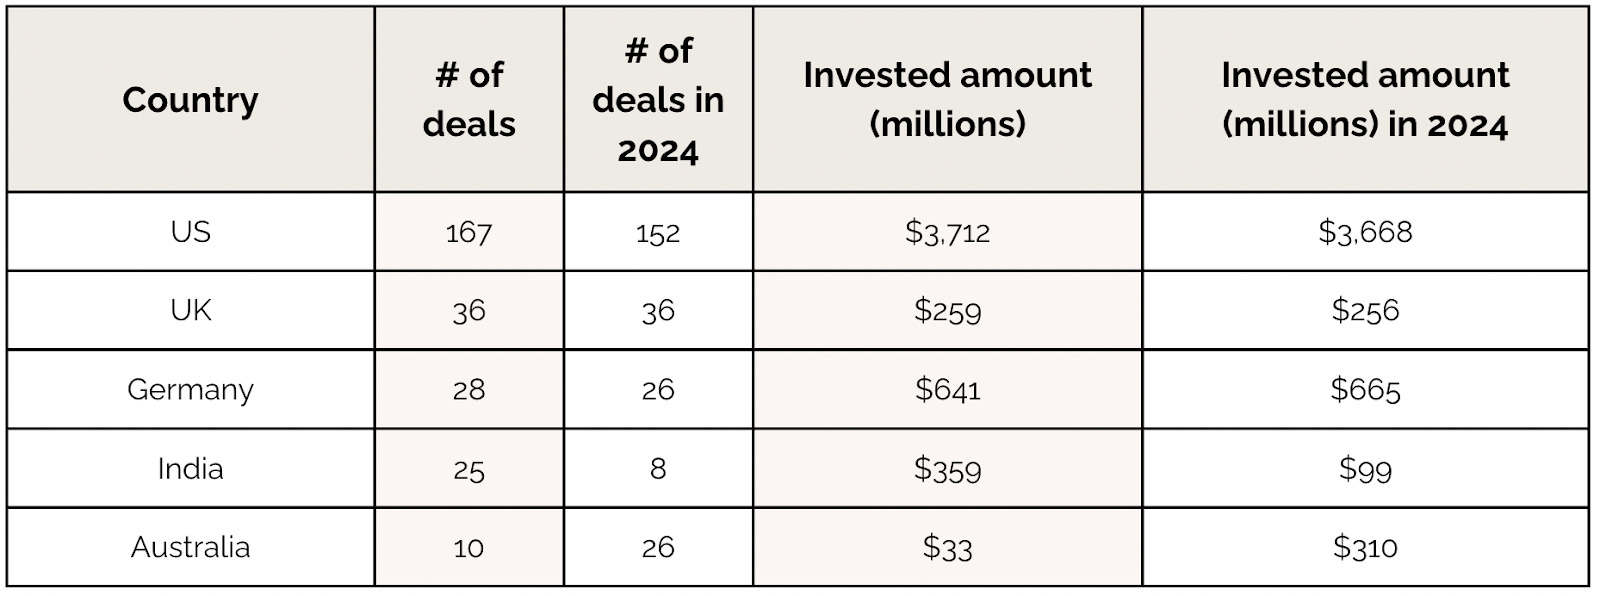
Investment by Country
The United States was the primary country for investment activity with 167 startups raising $3.7b. Germany, India and the UK were the next countries for investment activity.
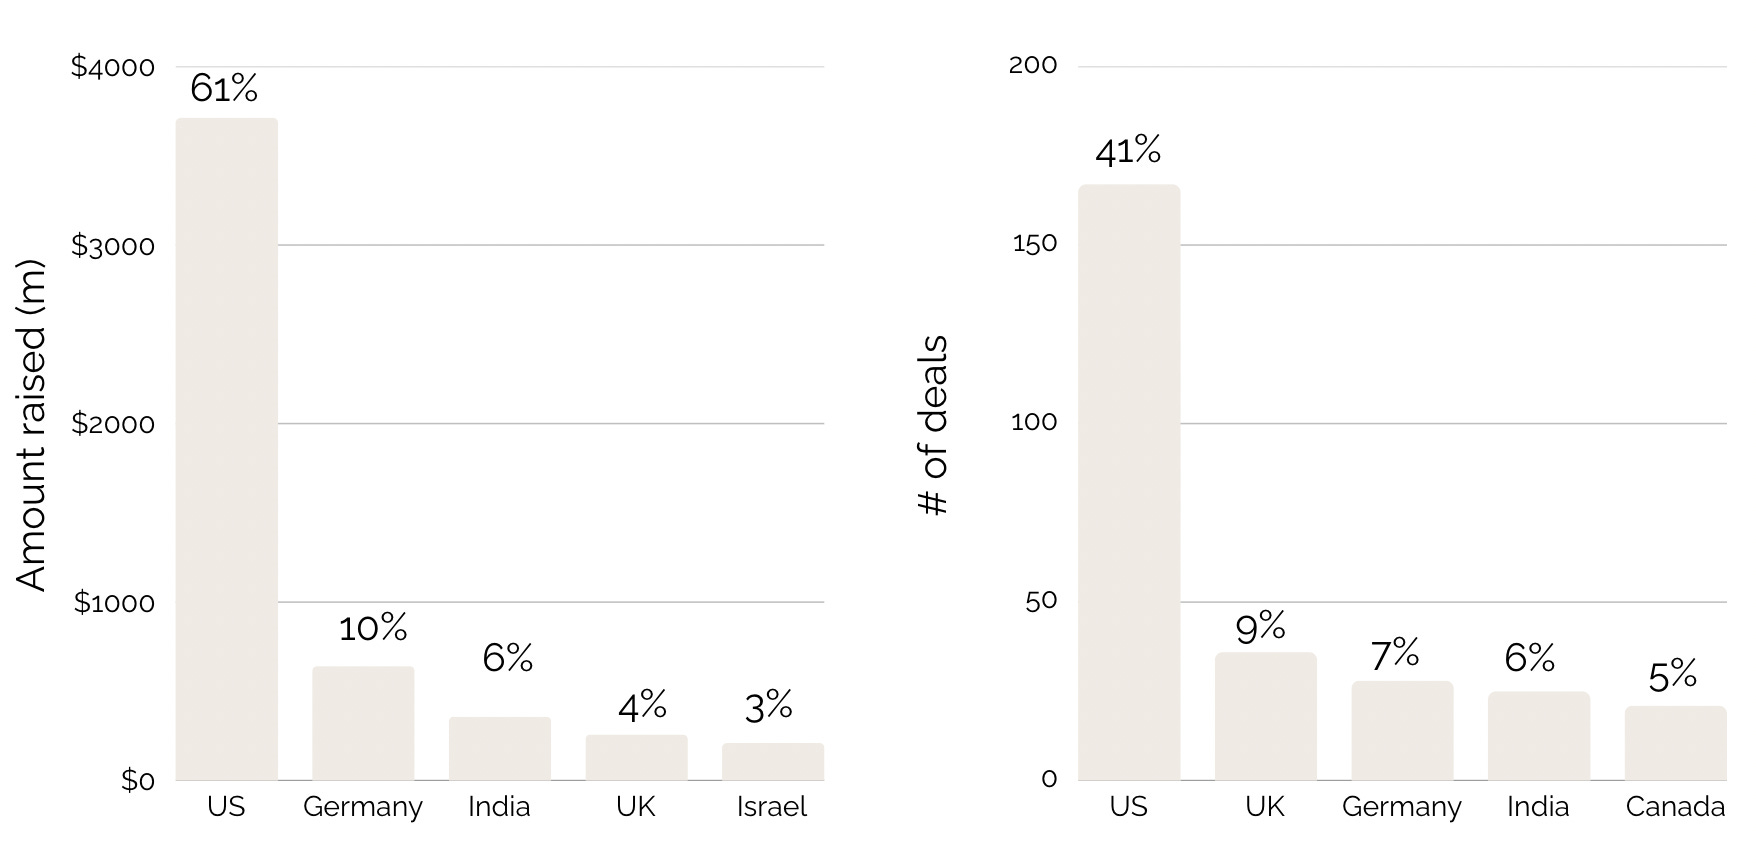
Comparing 2025 to 2024, the investment amount and number of deals was consistent for the US, UK and Germany. India however has tripled the number of startups raising rounds. The investment amount increased significantly in 2025 however this is largely due to Infra.Market raising $204m in preparation for their IPO. Australia has been included in the table below as there has been a relative fall in activity.
Investment by Category
Each startup was tagged by a category which we defined based on how the industry would use their solution. One notable distinction is the AI category.
Many startups this year mentioned their use of AI in the development of their product i.e AI powered estimating solution. In these cases these startups were categorized by how they are used (e.g estimating) and the category of AI was reserved for startups which are building solutions which were not previously possible without AI such as agentic or coworker solutions.
Number of Deals
The top category this year was Green Materials (36). 14 of these startups were located in the US which is notable given the shift in regulatory support. Under the Trump Administration there has been a pullback as exemplified by the cancellation of a $189m grant to Brimstone Energy that Biden approved in January to build a low carbon cement plant (note this grant has been included in the raw data as a funding round as the decision is being appealed).
Procurement was second with 32 deals and then Robotics with 22. The latter is of note as anecdotally from conversations there appears to be a surge in interest in robotics as the technology is becoming viable as the hardware (e.g sensors) is falling in costs and physical AI models are improving making it cheaper and faster to build and deploy initial solutions. Autonomous equipment which included startups such as Bedrock Robotics which creates self driving kits to retrofit excavators, was categorized separately to robotics and had 5 startups raising $144.3m. This category is likely to grow concurrently due to similar tailwinds.
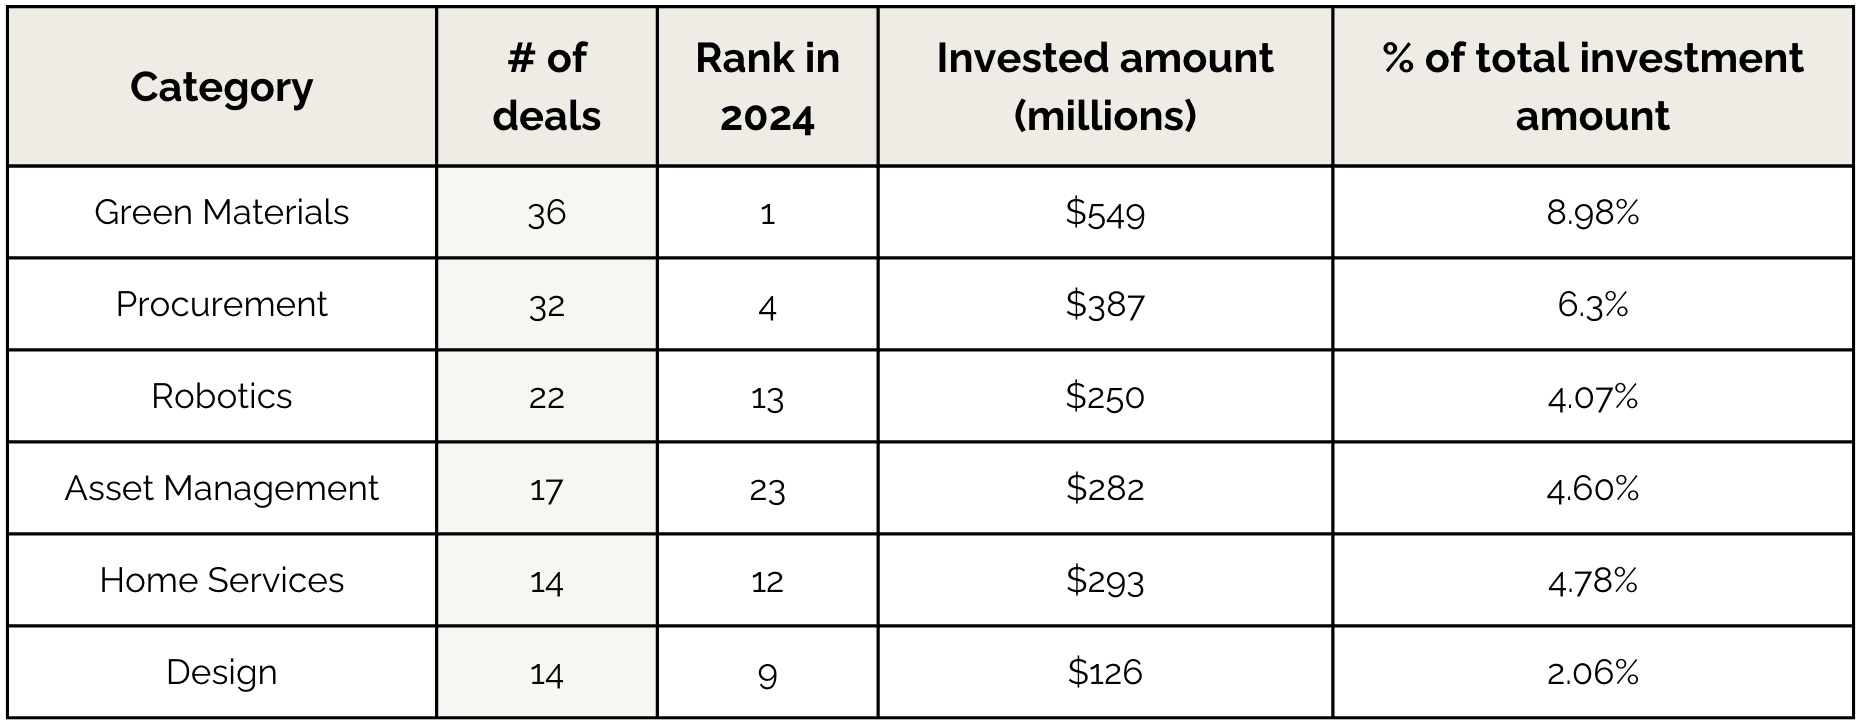
Safety is noticeably absent as a top category. This year there were only 3 funding rounds with $14m raised in contrast to last year when there were 15 rounds accounting for $300m, though HammerTech and SafetyCulture contributed to $150m of the funding amount.
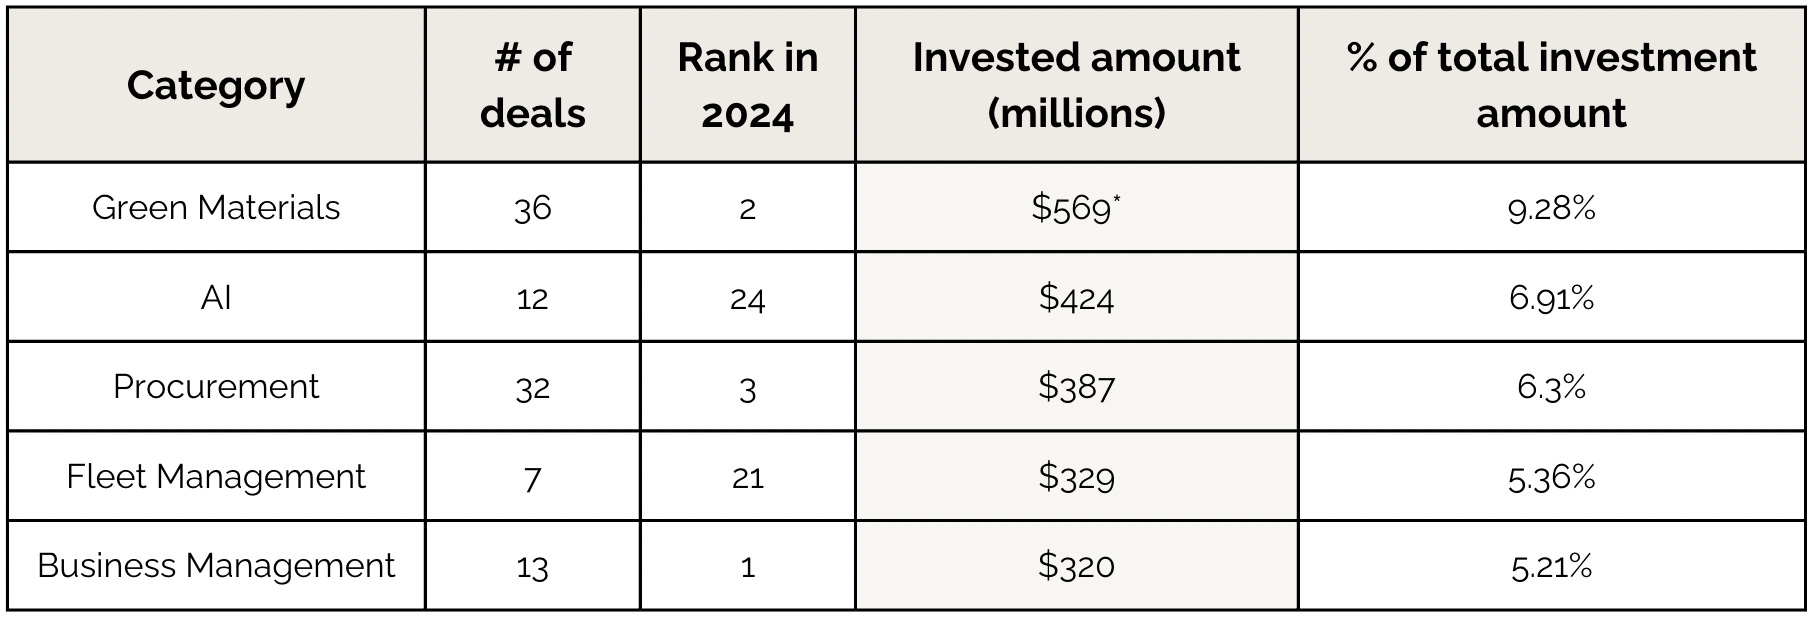
Amount of Funding
Green Materials accounted for the most funding ($569m). One caveat (as mentioned above) is that $189m was granted funding to Brimstone Energy which was cancelled by the new administration.
AI was the next highest category and it is important to note that FieldAI accounted for $314m of the total of $424m.
Procurement was third with $387m with Infra.Market accounting for $204m and Fleet Management ($329m) and Business Management ($320m) categories rounding out the top 5.
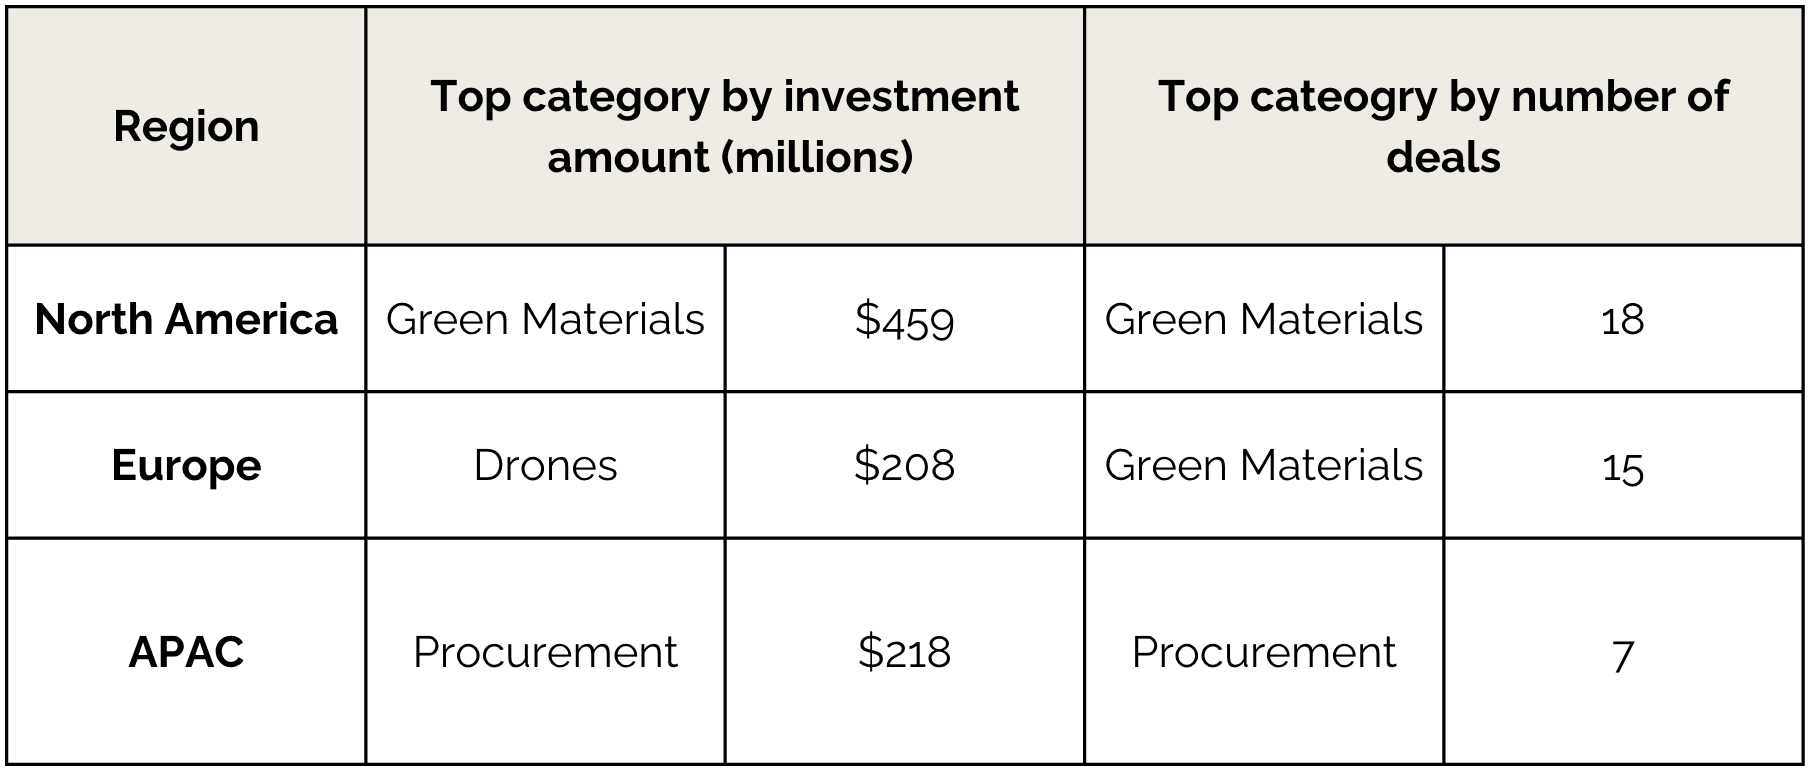
Top Category by Region
Green Materials was the top category for both investment amount and number of deals in North America. Again this is surprising given the political environment however the majority of the funding rounds (10) were in the first half of the year. Given that many funding rounds are announced months after they close due to approvals and PR timelines, some of these rounds may have been completed before the current government’s policy direction became clear. It will be interesting to see the investment in this category over 2026.
Drones was the top category for funding in Europe and this was due to Quantum Systems raising €180m. They are a drone platform with military applications as well as industry applications such as mapping infrastructure for digital twin and disaster prevention applications. If they were excluded from the calculation (as they don’t only service construction) Home Services came next with $201m raised.
In APAC, Procurement was the top category for funding and number of deals.
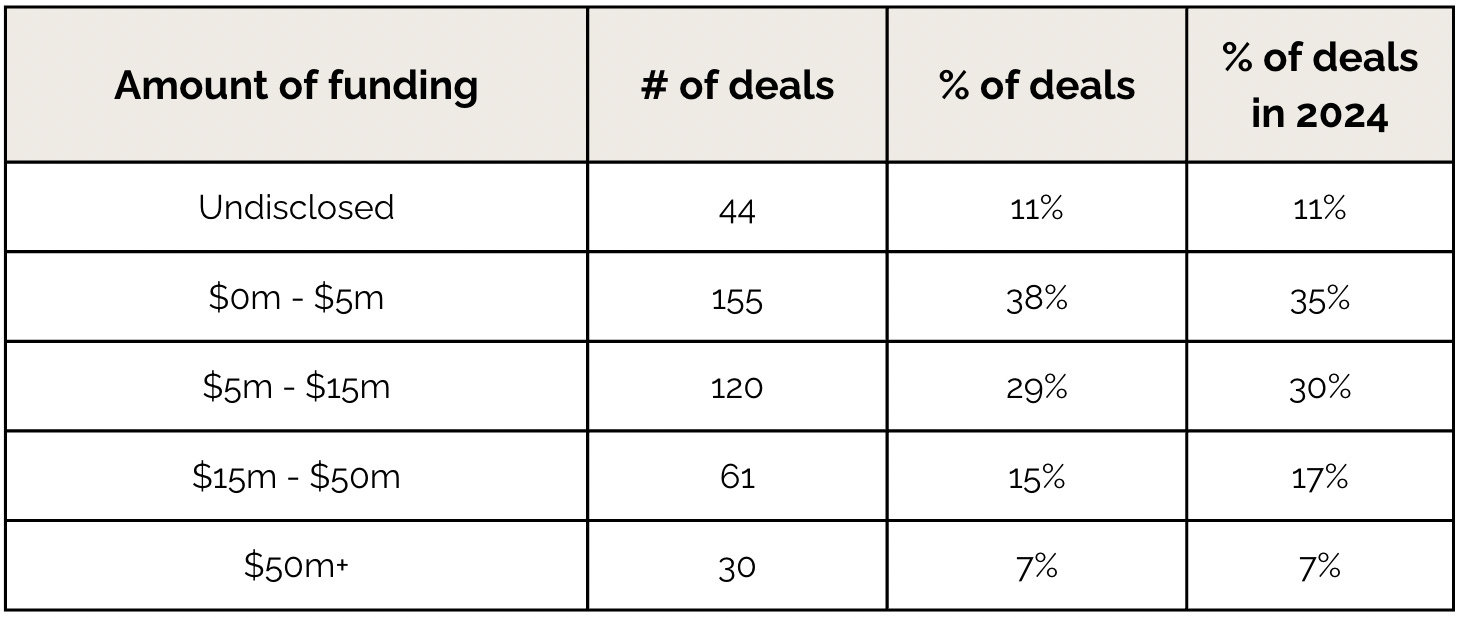
Investment by Bracket (stage)
Usually there’d be a comparison of funding by stage (e.g seed, Series A etc) however public data was limited with only 236 of the 411 deals tracked providing this.
To compensate, an analysis was undertaken through grouping by funding bracket.
This year, the majority of deals were at an earlier stage at $0m to $5m in funding, correlating to Seed stage investment. The next highest was the $5m to $15m which loosely correlates to Series A funding.
The % of deals in each bucket has stayed relatively constant between the years.
Overall, the construction tech ecosystem continues to remain robust and an emerging part of the general venture landscape. While the number of deals has grown this year, there is still an opportunity for further growth as a % of total venture investment.
The category is limited by marketing and awareness as the term ‘ConTech’ is not as prominent as ‘FinTech’ or ‘HealthTech’. As it rises in popularity over the coming years we will see the entrance of more generalist funds which will help increase the amount of funding.
Stay tuned for our next post where we use the above data to share our ConTech Predictions for 2026.